Instagram Profile Growth Down 21%, Engagement Down 2% Since The Algorithmic Feed Introduction
Tina Ahmed posted on 11 July 2016
The first half of the year 2016 is behind us. We wanted to take this opportunity to review the Instagram growth and engagement trends we’ve seen during the year.
This post is the recap of what we’ve discovered by analysing 2,500 Instagram profiles during the year.
More than half a billion users
Instagram has added 100 million monthly active users since September, which brings the platform on more than 500 million monthly active users. 80% of users are from outside the USA.
There are 300 million daily active users, they spend 21 minutes in the app, give 4.2 billion likes, and share 95 million photos and videos combined.
What do we know about content that works well on Instagram? Five of the main trending topic categories on the platform are fashion, music, food, travel and pets. How can your brand take advantage of these topics? Start creating great content about them, or sponsor those that already do and have established audiences.
Initiatives to boost sharing
Time spent in the app has held steady since 2014, but the users are sharing content less frequently. This is the same problem that Facebook is facing.
Users are increasingly more likely to use the newsfeed-based platforms to view content, rather than post something original themselves.
Users are spending an increasing amount of time posting and engaging in messenger apps such as Snapchat and Whatsapp.
Instagram is considering several initiatives to boost sharing. Live video, 360-degree video, and even the ability to reshare images may be coming soon. The switch to an algorithmic feed at the start of June is the big bet in the hope of boosting the activity and sharing.
The algorithm prioritises content posted by friends rather than celebrities and brands as the company has noticed content by friends getting higher engagement: “A spokesperson said that people are liking more posts and commenting more frequently since the algorithm rolled out in May.”
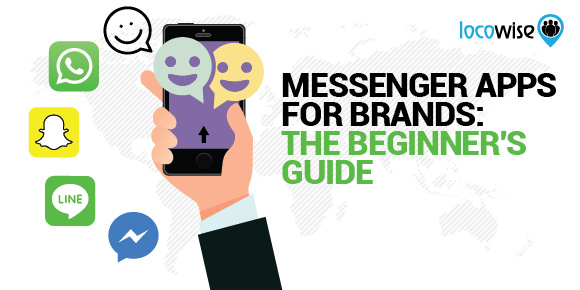
June saw the lowest profile growth since we started our studies
So how has the growth and engagement looked like in the month since the introduction of the algorithmic feed?
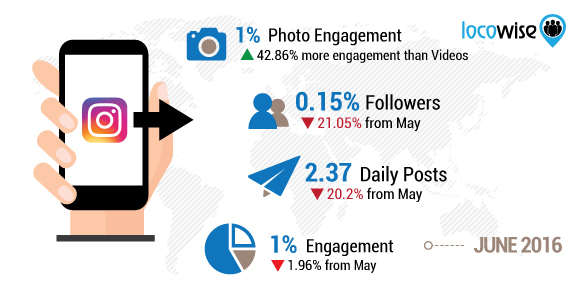
Growth in June was at 0.15% of the total followers. This is a 21.05% decrease from May and the lowest follower growth since we started doing our studies in April 2015.
Engagement rate in June was at 1% of the total followers. This is a 1.96% decrease compared to May, but it’s 19.05% higher than the low point in February 2016. Photos engage 1% of the audience on average while videos engage 0.7%. Posting images gives you a 42.86% engagement boost compared to posting videos.
Posting activity in June has declined by 20.2% compared to May. There was a spike in posting activity in May with brands posting 2.97 times per day on average. In June brands posted 2.37 times on average per day, and this is more similar to the levels we’ve seen pre-algorithm (2.43 posts per day in April).
Instagram still beats Twitter and Facebook
Very early conclusion on the impact of the algorithmic feed is that it hasn’t helped brands get more growth and engagement on the platform. Profile growth is down to the lowest levels we’ve seen, and engagement hasn’t improved either.
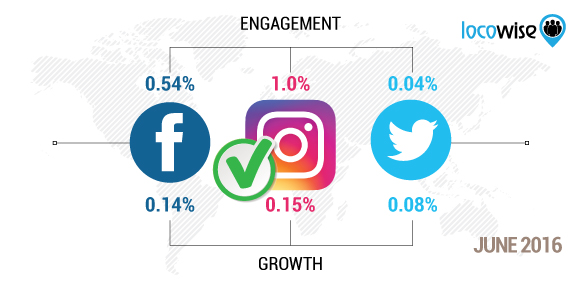
Note that Instagram still engages more people than Facebook and Twitter. On Twitter, profiles engage 0.04% of the total audience on average, while this number is at 0.54% on Facebook. Instagram posts get 2400% more engagement than Twitter and 85.19% more than Facebook.
Profile growth is higher on Instagram as well. Facebook pages grow by 0.14% and Twitter profiles by 0.08%. Instagram profiles grow 87.5% more than Twitter profiles and 7.14% more than Facebook pages.
Here’s a quick overview of growth and engagement rate trends on Instagram:
Followers Growth
| Apr | May | Jun | Jul | Aug | Sep | Oct | Nov | Dec | Jan | Feb | Mar | Apr | May | Jun |
|---|---|---|---|---|---|---|---|---|---|---|---|---|---|---|
| 1.95 | 1.48 | 0.49 | 0.34 | 0.56 | 0.25 | 0.26 | 0.28 | 0.23 | 0.37 | 0.2 | 0.32 | 0.16 | 0.19 | 0.15 |
Engagement Rate
| Apr | May | Jun | Jul | Aug | Sep | Oct | Nov | Dec | Jan | Feb | Mar | Apr | May | Jun |
|---|---|---|---|---|---|---|---|---|---|---|---|---|---|---|
| 2.8 | 2.61 | 2.14 | 2.12 | 2.25 | 1.76 | 1.36 | 1.12 | 1.08 | 0.95 | 0.84 | 1.1 | 1.04 | 1.02 | 1.0 |

