The Latest Facebook News Feed Algorithm Update And What Brands Need To Know
Tina Ahmed posted on 18 July 2016
The first half of the year 2016 is behind us.
We wanted to take this opportunity to review the Facebook growth and engagement trends we’ve seen during the year.
We also wanted to take a look at the latest changes to the news feed algorithm and how they may affect your brand reach and engagement.
This post is the recap of what we’ve discovered by analysing 5,000 Facebook pages during the year.
The latest news feed algorithm tweak: Family and friends first, entertainment and information second
The big news in June was the announcement of the most recent news feed algorithm tweak and the news feed values. The goal for Facebook is to have users engage more and spend more time on the platform.
The latest update to the algorithm “helps you see more posts from your friends and family”. Facebook is “updating News Feed over the coming weeks so that the things posted by the friends you care about are higher up in your News Feed.”
Friends and family come first in the news feed. After that, the news feed aims to inform and entertain users.
What type of content informs users? The user decides this with the actions he or she takes on the platform, but Facebook said: “this could be a post about a current event, a story about your favorite celebrity, a piece of local news, or a recipe.”
What type of content entertains users? According to Facebook: “following a celebrity or athlete; for others it’s watching Live videos and sharing funny photos with their friends”.
Facebook algorithm loves “authentic stories” and doesn’t like stories that people find “misleading, sensational and spammy”.
How can your brand create content that informs and entertains the fans? We have a guide on how you can create content within some particular killer categories.
This update may cause reach and referral traffic to decline for some Pages
How will this update impact brands and their Facebook pages? Here’s what Facebook said: “Overall, we anticipate that this update may cause reach and referral traffic to decline for some Pages. The specific impact on your Page’s distribution and other metrics may vary depending on the composition of your audience. For example, if a lot of your referral traffic is the result of people sharing your content and their friends liking and commenting on it, there will be less of an impact than if the majority of your traffic comes directly through Page posts. We encourage Pages to post things that their audience are likely to share with their friends.”
What’s the conclusion for brands here? If your fans share your content, you are all good. If you rely on reaching users organically through your Facebook page, you might be in trouble.
What are options for brands? Facebook advertising is the obvious option for those with large budgets. You can simply pay to reach all the people that like your page and other users you are interested in attracting.
Anything else brands can do? Work on your social media strategy. Take actions not to be heavily dependant on one platform when it comes to your organic marketing and content distribution. Continue publishing the incredibly shareable content. Redesign your blog and website to put prominent social sharing buttons on your content. Start tracking all the reach and engagement metrics for all the content that you publish in order to find out what works and what doesn’t. Locowise is your friend here.
Should brands just publish video posts and do live broadcasts? Videos do tend to get higher reach and engagement (we’ll look more into that in a moment), but the new update is “agnostic of media type” which means that all post formats (including Live and Instant Articles) will be impacted.
Let’s take a look at the latest Facebook page growth, reach and engagement data for more insights into this.
Page likes growth and reach down, but engagement is up
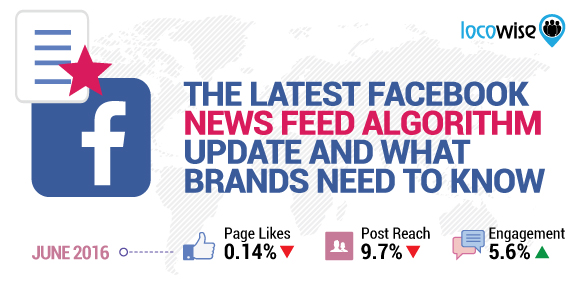
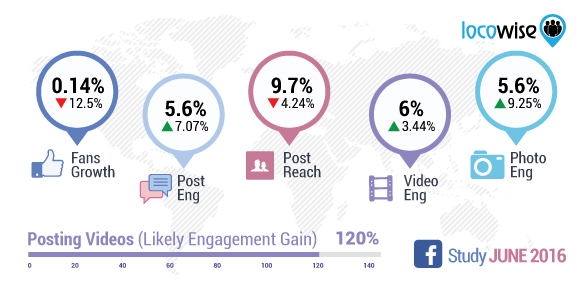
Page likes growth in June was at 0.14% of the total audience. This is a 12.5% decrease compared to the month of May.
It’s the lowest growth (alongside December 2015 and February 2016) that we’ve seen since started doing our studies in May last year.
The average reach per post in June was at 9.7% of all page likes. This is a 4.24% decrease compared to May and it’s the lowest reach since December 2015.
Engagement per post was at 5.6% of the people reached. This is a 7.07% increase compared to last month, and it’s the highest engagement we’ve seen since November 2015.
| May | Jun | Jul | Aug | Sep | Oct | Nov | Dec | Jan | Feb | Mar | Apr | May | Jun | |
|---|---|---|---|---|---|---|---|---|---|---|---|---|---|---|
| Page Growth | 0.2 | 0.2 | 0.21 | 0.28% | 0.24 | 0.2 | 0.18 | 0.14 | 0.16 | 0.14 | 0.18 | 0.18 | 0.16 | 0.14 |
| Post Reach | 8.34 | 8.11 | 8.24 | 8.43 | 7.91 | 7.25 | 7.15 | 7.39 | 10.31 | 10.86 | 11.41% | 10.71 | 10.13 | 9.7 |
| Post E.R | 6.61% | 6.19 | 6.27 | 5.93 | 6.15 | 5.87 | 5.77 | 5.01 | 4.45 | 4.9 | 4.92 | 5.04 | 5.23 | 5.6 |
Videos continue to dominate the post format reach
Video posts reached the most people in June. 11% of all page likes saw the average video post, while 10.2% were reached by a photo, 8.6% by a link thumbnail and 4.6% by a plain status update. The video has dominated and continues to dominate the post format reach throughout the period of our studies.
| Reach | May | Jun | Jul | Aug | Sep | Oct | Nov | Dec | Jan | Feb | Mar | Apr | May | Jun |
|---|---|---|---|---|---|---|---|---|---|---|---|---|---|---|
| Videos | 11.86 | 11.02 | 10.89 | 9.53 | 9.42 | 9.24 | 8.94 | 9.14 | 12.25 | 12.62 | 12.81% | 12.17 | 11.3 | 11 |
| Photos | 7.86 | 7.66 | 7.79 | 7.96 | 7.75 | 6.84 | 6.7 | 6.83 | 10.47 | 11.79 | 12.04% | 11.53 | 10.67 | 10.2 |
| Links | 9 | 9.04 | 9.23 | 8.99 | 8.95 | 8.53 | 8.36 | 8.9 | 9.82 | 9.08 | 10% | 9.32 | 9.36 | 8.6 |
| Status | 6.12 | 5.7 | 6.57% | 6.28 | 5.51 | 4.44 | 5.23 | 3.76 | 5.02 | 5.7 | 6.45 | 5.09 | 5.28 | 4.6 |
Status update leads the post format engagement
Status updates engaged the most of the people reached in June. 6.6% of people reached engaged with a status update, 6% engaged with a video post, 5.9% with a photo and 4.6% with a link thumbnail.
| E.R | May | Jun | Jul | Aug | Sep | Oct | Nov | Dec | Jan | Feb | Mar | Apr | May | Jun |
|---|---|---|---|---|---|---|---|---|---|---|---|---|---|---|
| Videos | 6.61 | 6.51 | 6.79% | 6.46 | 6.53 | 5.98 | 6.11 | 4.73 | 4.73 | 5.01 | 5.16 | 5.26 | 5.84 | 6 |
| Photos | 7.06% | 6.49 | 6.57 | 6.32 | 6.6 | 6.23 | 6.05 | 5.4 | 4.52 | 4.84 | 5.11 | 5.26 | 5.35 | 5.9 |
| Links | 4.37 | 4.25 | 4.25 | 3.92 | 3.96 | 3.93 | 3.82 | 3.44 | 3.63 | 3.89 | 3.8 | 4.11 | 3.91 | 4.6% |
| Status | 3.34 | 4 | 4.05 | 4.12 | 4.25 | 4.19 | 4.04 | 3.77 | 4.13 | 4.3 | 4.74 | 5.4 | 5.03 | 6.6% |
The average post in June engaged 0.54% of the total page likes. Videos and photos performed better than average by engaging 0.66% and 0.6% of the total audience. Link thumbnails engaged 0.4% of the page likes, while status updates engaged 0.3%.
You stand to gain 120% more engagement by posting videos and 100% more engagement by posting photos rather than posting plain status updates.
41.12% of pages used Facebook advertising
41.12% of pages used Facebook advertising in June. They paid for 31.5% of their total reach. 1.74% fewer pages used Facebook advertising and the percentage of paid reach was 0.72% lower than in the month of May.
| May | Jun | Jul | Aug | Sep | Oct | Nov | Dec | Jan | Feb | Mar | Apr | May | Jun | |
|---|---|---|---|---|---|---|---|---|---|---|---|---|---|---|
| Using Ads | 43.36% | 45.59% | 41.12% | 41.54% | 42.95% | 43.41% | 42.01% | 42.15% | 38.51% | 41.2% | 42.15% | 43.28% | 41.85% | 41.12% |
| Paid Reach | 31.51 | 31.07 | 28.56 | 29.56 | 30.83 | 30.54 | 28.98 | 30.18 | 28.5 | 29.91 | 30.01 | 31.68 | 31.73% | 31.5 |

