New Social Stats You’ve Gotta Have
Catherine Hayden posted on 7 March 2017
It seems like 2017 has just started and the new research is already flooding in.
Working in social media, information overload can get very real. Having to wade through pages of reports to find good stats doesn’t help.
So we’ve taken the best of the latest research and put it all together in one place for you.
Social Media Use By Age Group
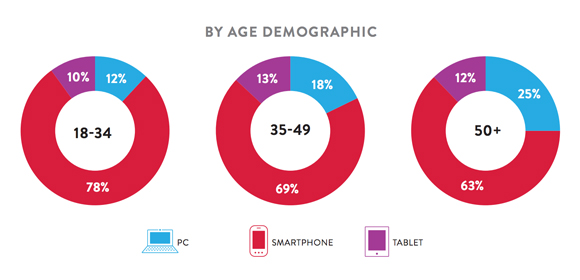
According to a study by Nielsen published in January, Americans aged 18-34 are far less obsessed with social media than adults 35 and over. The older generation (think 50 and up), unsurprisingly, spends less time online.

Americans aged 35 to 49 (Generation X) spend almost seven hours on social media a week
Americans aged 18 to 34 spend six hours and 19 minutes a week on social media networks
Adults aged 50 and over spend a much less time online – an average of just over four hours a week on social media
The Platforms: A Breakdown
Nielsen found that, unsurprisingly, Facebook took the lead when it came to popularity.
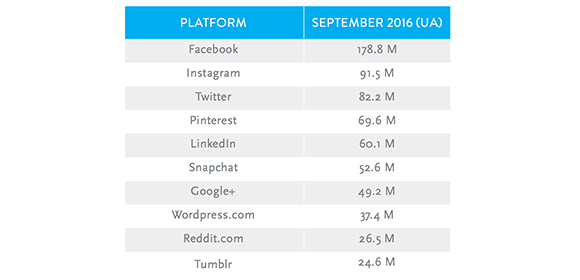
They say that Facebook had about 178.2 million unique users when they gathered their data in September 2016.
Instagram came in second place, with 91.5 million users. Twitter had 82.2 million unique users, while Pinterest came in last with 69.6 million users. Snapchat came in at sixth place, behind LinkedIn.
But that’s just in North America and the data may have been published recently but was, after all, gathered some time ago.
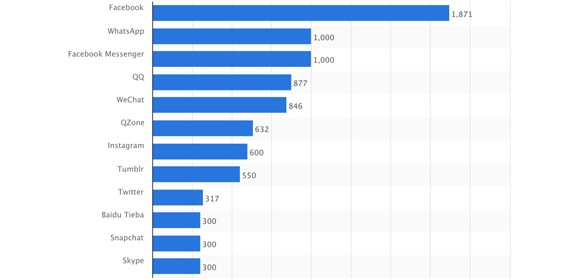
More recently, Statistica released a report listing what they call ‘the most famous social network sites’ as of January 2017. The breakdown looks like this:
Facebook, the first platform to grow beyond 1 billion registered accounts, had 1.87 billion monthly active users at the time of the study
Instagram had over 600 million active accounts and ranked seventh overall on a list that included messaging apps like Whatsapp (second overall) and Facebook Messenger (third)
Twitter was still lagging behind the rest of the pack with 317 million global users
Snapchat, the platform that targets the youngest social media consumers, had 300 million global users
Smartphone Social Media
Nielsen’s research focused on smartphone users, showing just how many people in the US have access to them:
97 percent of people between age 18-34 have smartphones
94 percent of people aged 35-49 have smartphones
77 percent of people 50 and older have smartphones
The smartphone users were the top ‘second-screeners’, of course. Second-screeners tend to use two screens at once, one being their mobile.
It turns out that Generation X are the biggest multitaskers, with 42 percent of people tweeting or Facebooking about a TV show while they watched it being aged 35-49. Millennials follow closely behind, though, with 40% doing the same.
Platform Demographics
Research from Pew published in late 2016 looked at US social media users who accessed the internet from any source – they didn’t limit themselves to smartphones. Pew looked at platform popularity, how much time people spent online, and the age of users. This is what they found among US adults who were online:
68 percent of all adults use Facebook
Young adults are using Facebook at a steady (and high) rate
More older people are starting to use Facebook
More women than men use Facebook (83 percent and 75 percent, respectively)
Facebook is still the most popular platform, visited more often than competitor sites/apps. Roughly three-quarters of Facebook users check in daily, with more than half checking their feeds a few times a day
Of Americans using Facebook on smartphones and online, 88 percent are 18-29. Eighty-four percent are 30-49.
28 percent of all US adults use Instagram
Younger adults are more active on Instagram
59 percent of people aged 18-29 use Instagram
33 percent of people aged 30-49 use Instagram
8% of people aged 65 and older used the platform
Women are still more likely to use Instagram than men (38 percent vs 26 percent)
24 percent of online adults used Twitter (the same number as in a 2015 survey)
Younger Americans are more likely to be on Twitter
36 percent of Americans aged 18-29 who are online use the social network, compared to 23 percent in the 30-49 age group
Only 10 percent of online Americans aged 65-plus are on Twitter
More Americans with university degrees use Twitter than those who have completed high school (29 percent vs. 20 percent)
The Social Media Matrix
Social media users aren’t predictable when it comes to which platforms they use in combination, but Pew has found some useful facts and trends for social media managers. The ‘social media matrix’ is a way to describe patterns researchers find when they look at which platforms people are most likely to use together.
The majority of social media users are on more than one platform. More than half of Pew’s respondents used more than one of the five networks their study focused on: Facebook, Instagram, Twitter, LinkedIn, and Pinterest. This was very similar to their findings a year before.
Facebook has long been the first social media site people use, and it still is, says Pew. Among the people they reviewed who only used one platform, 88 percent said this was Facebook. At the same time, most people who use a few different social media platforms say they use Facebook, too. A full 95 percent of Instagram users are also on Facebook. For Twitter, that figure drops a little to 93 percent.
Pew found links between other platforms, too. Sixty-five percent of people with a Twitter account also have Instagram, while 49 percent of Instagram users also have Twitter. That may sound like a no-brainer, but there’s a good chance you didn’t know how many Instagram users are also Pinterest fans: 54 percent. When it comes to what researchers call ‘reciprocity’, Pinterest returns the favour to Instagram – 57 percent of Pinterest users are on Instagram, too.
But The Numbers Don’t Make Sense!
Not all research is equal. Some research is different from other research, but it’s equally good. Take the research in this post by Pew, Nielsen, and Statistica as an example. They’re all respected and reliable sources of information, but sometimes they’re conflicting.
Does Pew’s research mean that Nielsen is wrong in saying millennials are the biggest social media users? Not really. Here’s an example:
Nielsen says: Americans aged 35-49 spend the most time on social media a week.
Pew says: 88 percent of Americans using social media are 18-29. Eighty-four percent are 30-49.
Nielsen and Pew are saying two different things. What’s more, they’ve gathered and presented their data differently. Nielsen’s survey found that Americans we consider ‘millennials’ spend more *time on social media.
Pew found that the greatest number of Americans using social media are *aged 18-29. At first glance, this information might seem conflicting, but it isn’t – it’s different.
How people gather their research and organise their data matters. Nielsen is looking at data drawn from American smartphone users, dividing them into groups that reflect the generations we call ‘X’ and ‘millennials’.
Pew is looking at the use of social media in American adults who are online (this doesn’t confine them to smartphones) and has organised age groups differently to Nielsen’s.
When you look at the research from Statistica, you’re looking at global research. That is, they’re not focused on the US, but rather on worldwide information. Again, this doesn’t make it better or worse than the other research. It just means you need to use different lenses when you’re interpreting the research.
Manage Research Like A Boss
When you come across new research, before you jump to any conclusions, think about:
METHODOLOGY : Does the research come from surveys or from data gathered online? Data gathered online is far more likely to be accurate as you’re dealing with numbers without the bias that can come in when researchers pose questions to people, or the chance that people may leave out information.
VALIDITY : When you’re reading a study, don’t assume it’s ‘right’. See who is behind the research, and whether it was in their best interest to reflect a certain result or point-of-view. At the same time, see if the research matters to you. Unfortunately, much of the research on social media trends that comes out is from the US and if your brand doesn’t target the US market, not everything you read will be relevant to you.
SAMPLE SIZE : Sample size refers to how many people were involved in a study. The bigger the sample, the better. As a rule, a larger sample size means more precise results. That’s what you want from research.
If the research measures up on all three fronts you’re good to go. As a rule, though, never go with a single study – rather look at a few and see if they’re saying the same thing. If they’re not, you’ll need to think about why (see above). Alternatively, you can just read our blog and save yourself a lot of time.


