Facebook Page Likes Growth Hits The Low Point In September 2016
Tina Ahmed posted on 26 October 2016
This is our Facebook page likes growth and content engagement study for the month of September.
Examine the performance of these 5,000 pages to what the standards are on the platform.
This helps you benchmark your own results.
Take a free Locowise trial now if you’d like to compare your own pages against pages in our study in our Facebook Analyser tool.
Let’s get started.
Growth and engagement in September
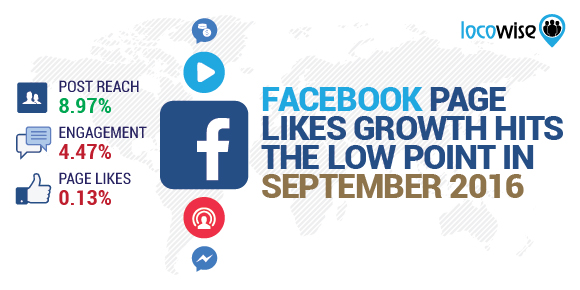
Page likes growth was at 0.13%. It’s 7.14% down from 0.14% page likes growth in August. It’s also the lowest page likes growth since we started these monthly studies in May 2015. The continuous decline of organic page likes growth has resulted in the audience size becoming a secondary metric on Facebook. Still fewer companies focus on it in their targets and goals, so do make sure to revisit it if your bosses still look at this as a priority.
On the other hand, here’s some more happy news for social media managers. Reach per post was at 8.97% of the total audience. This is a 37.58% increase compared to August, which was the lowest point since we started our studies.
Photos reached 10.3% of page likes, videos reached 9.89%, while link posts reached 6.1% and status updates 5.17%.
Reach may have increased, but engagement is on a downhill. Engagement rate was at 4.47% of people reached. This is a 2.4% decrease compared to August and the second lowest engagement rate since we started our studies. The low point was in January this year with an engagement rate of 4.45%.
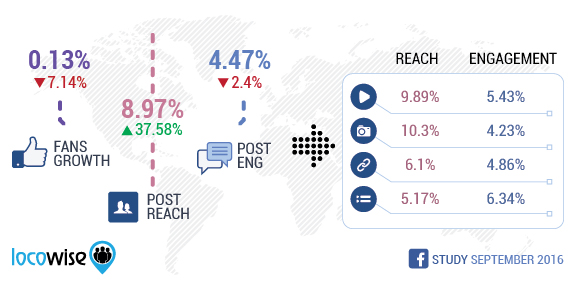
Surprisingly it was the status updates that engaged the most people. 6.34% of people reached engaged with a status update, 5.43% engaged with a video, 4.86% with a link and 4.23% with a photo. Facebook is pushing everyone to create more video, while users engage most plain status updates. This was the case in September at least.
Only 16.14% of pages we looked at used Facebook advertising to promote their page posts. On average they paid for 26.62% of their total reach.
The average user reads 200 Facebook posts per day
Some new stats were released during the month. Facebook curates 2,000 news story for the average user every day. The average user only reads 200 of these. The other 90% are not seen. And we know that Facebook prioritizes posts from family and friends.
This is what you’re up against as a brand posting on Facebook if you focus solely on organic distribution.
Adam Mosseri, vice president of product management, said: “Slowly and steadily over time, people are spending more time reading more, liking more, and commenting more. We hope that’s a signal that we’re making the experience more interesting and relevant to people.
Sharing is an important part of the ecosystem from friends-to-friends, it’s healthy and it’s growing. It’s not growing as fast as publisher (public) sharing. There are more and more publishers posting to Facebook everyday and they’re posting more often”.
Average time user spent watching video metric was miscalculated
Facebook also disclosed that the metric for the average time users spent watching videos was overestimated. The company only factored in video views of more than three seconds and ignored all users that were briefly exposed to the video as they scrolled through their news feed.
Publicis Media agency estimated that Facebook inflated the average time spent watching a video by 60% to 80%. The error has been fixed now, and the old metric was replaced with “Video Average Watch Time”. The new metric includes video views of any duration.
Facebook has apologized saying: “The metric should have reflected the total time spent watching a video divided by the total number of people who played the video. But it didn’t. While this is only one of the many metrics marketers look at, we take any mistake seriously.”
Facebook also called ad-buyers to deemphasize soft metrics such as likes and impressions, and focus on “metrics that actually matter to driving business outcomes. There is very universal agreement that the industry needs to evolve to metrics that actually matter”.
People love vertical videos
Vertical videos, which we discussed last month, are now live to all. And the early numbers are promising. Laundry Service, a social media agency, reported that “the CPM is three times less expensive on vertical video than square thus far. For example: $5 CPM versus $15 CPM. This signifies that the content has a higher view through, share/engagement rate, etc”.
Have your tried vertical video yet?
New features for Facebook live video
Facebook Live is a key feature for the future of Facebook. That’s according to Facebook and Mark Zuckerberg himself. The company wants you to start broadcasting your life. A major advertising campaign that promotes Facebook Live is being prepared.
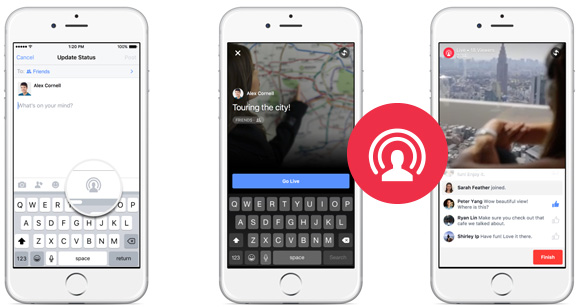
Facebook is improving the features at the same time. The ability for people to broadcast live video from desktops and laptops is being rolled out. Live broadcasters will soon be able to pin comments to the top of the thread in order to highlight them to other viewers.
Page admin role for live broadcasters is going live soon too. This would be useful if you want to allow someone to live broadcast to your audience but don’t feel comfortable about allowing that person to have all the other admin rights to the rest of your page. You can simply set the person to only have the “broadcaster role”.
Picture: Facebook
And an update on Facebook Messenger bots
34,000 developers have joined the Facebook Messenger platform and have built 30,000 bots since April 2016 when it all launched. One of the newest features is the ability for users to make instant purchases directly in bots without leaving the platform.
Developers can now pull web interfaces into their bots and advertisers can use any of the news feed ads to promote bots. Slowly but surely this is becoming a serious platform for brands to consider in order to reach a larger audience.

