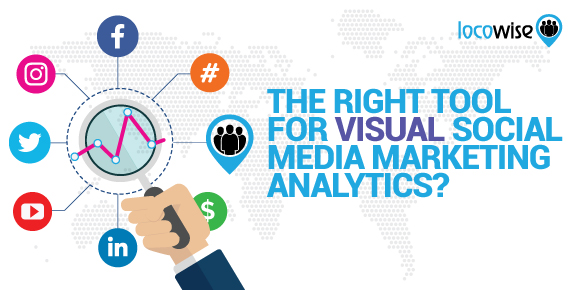
The Right Tool For Visual Social Media Marketing Analytics?
Ivan Ivanov posted on 21 February 2018
A star-wipe in a Microsoft PowerPoint presentation has been a running joke whenever someone needs to present information and data in a visually-appealing manner. And whether or not you have creative design talent, the fact of the matter is that an aesthetically pleasing design can go miles in serving your marketing purpose.
That’s why here at Locowise we don’t only focus on an intuitive user interface that allows you to access all the social media analytics you need, but we also put the time to help you make killer presentations for your clients in just a few clicks.
Whether you need full industry reports or data comparison between multiple social media profiles, we can help you dazzle your digital marketing service customers with visually compelling social media analytics like they’ve never seen before.
The Best Combination of Features and Visual Appeal
We are a data-driven bunch that loves the nitty-gritty details that go in the analysis of social media data. But we also enjoy the beauty that comes with an intuitive and visually-appealing design.
Thus, with Locowise you won’t have to worry about missing out on any of the two. By signing up for our visual social media marketing analytics service, you’ll have access to over a dozen different features that allow you to go through thousands of analytics on different social media profiles of both your clients and your competitors.
But we’ve also made sure to enable a great user-interface that helps you easily go through the tons of data without missing out on a single insight. The best part? We also aim to make your job easier by helping you present your social media strategies and reports to your clients in a visually-appealing manner. Let’s dive deeper into the subject matter!
Visual Media Analytics for your Clients
Locowise is a visual media marketing tool that is built from the ground up to serve digital marketing agencies to the best of our abilities. We understand that as an executive you have to deal with multiple clients, all of which require top-notch reports on their social media performance. Thus, to help you deliver the best possible results, while not worrying about the presentation of the analytics, we’ve developed a tool that does both!
With Locowise, you will be able to keep track of each little insight from the social media profiles of your client and their competitors, without missing a beat. In fact, you are able to go in-depth down to the performance of every single post. We even let you go through every comment left by your audience in an easy to follow and read fashion.
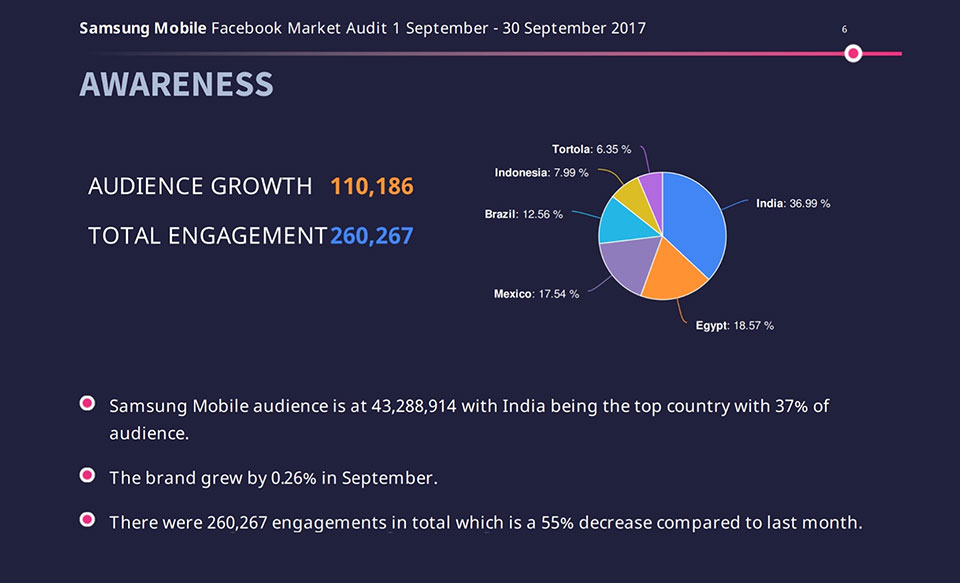
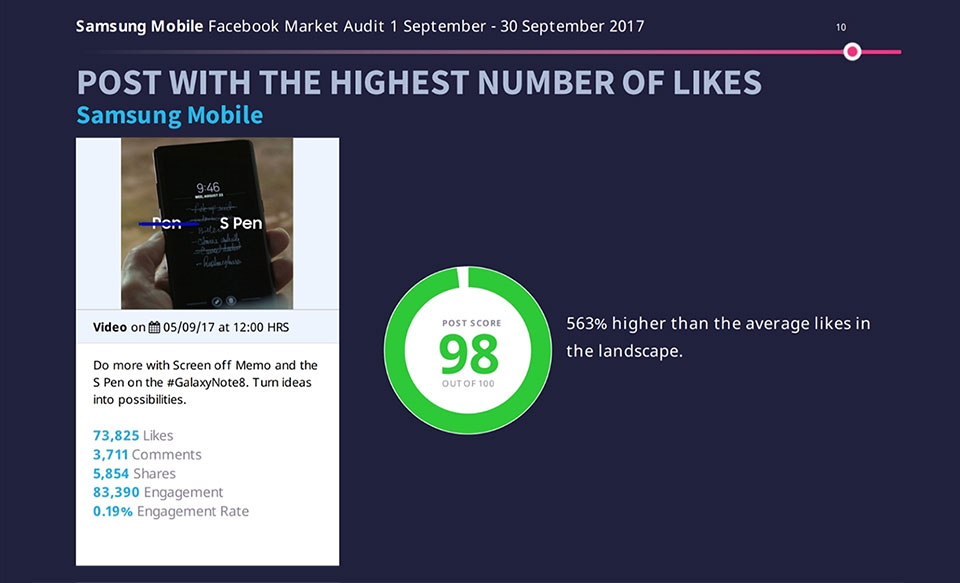
Yet, we’ve also made sure to incorporate the best possible visual analytics design for each graph and chart, so that you are able to WOW your client without the need of heavy infographic design investments. By using our tools, you will be able to create a great social media report within just a few minutes. Plus, it might also help you out get new prospective clients on board!
Simple Social Media Analytics For You
All of the aforementioned features are perfect for visual social media analytics presented to a client. But that doesn’t mean that they won’t help you out in the process of coming up with a digital marketing strategy.
With our intuitive UI, you will be able to go through the available data and find just the thing you are looking for without spending time going through different tabs to find the needed feature. Noticed a sudden drop in the ER on any given day and you wonder what has been posted on that exact date? Simply click on the graph and you’d be able to get just that information. It’s as easy and simple as that! But it doesn’t stop there!
From the very first time you open up Locowise and see your dashboard to the very account settings menu, we’ve designed each little detail with you in mind. The direction of the design of our user interface is directly related with the usability and intuitive ease-of-use of the magnitude of features we have available for our clients. Plus, we always listen to your feedback and make sure to tweak any issues that might arise on a per-case basis.
Of course, we don’t want to leave you out in the open without a proper introduction. If you are having any trouble with the interface of Locowise or can’t find the feature you are looking for, we have a support staff that is willing to help you out.
Plus, for our executive clients, we have individual tutorial sessions available to make the use of our visual analytics tool that much simpler and easier.
The Full List of Visual Social Media Analytics Features!
Still haven’t made up your mind about whether or not to choose Locowise? Here are the features you’d be able to get your hands on, if you do!
Easy to Capture and Export Graphs
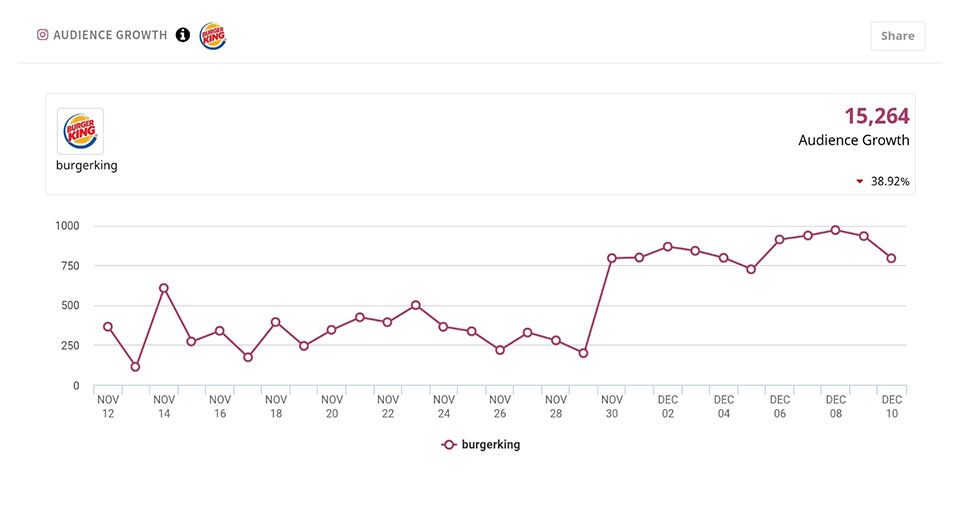
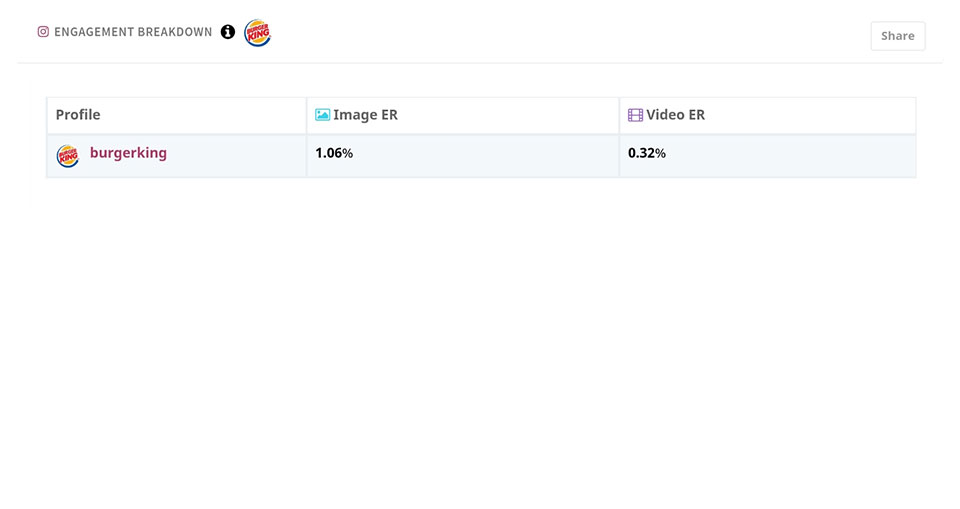
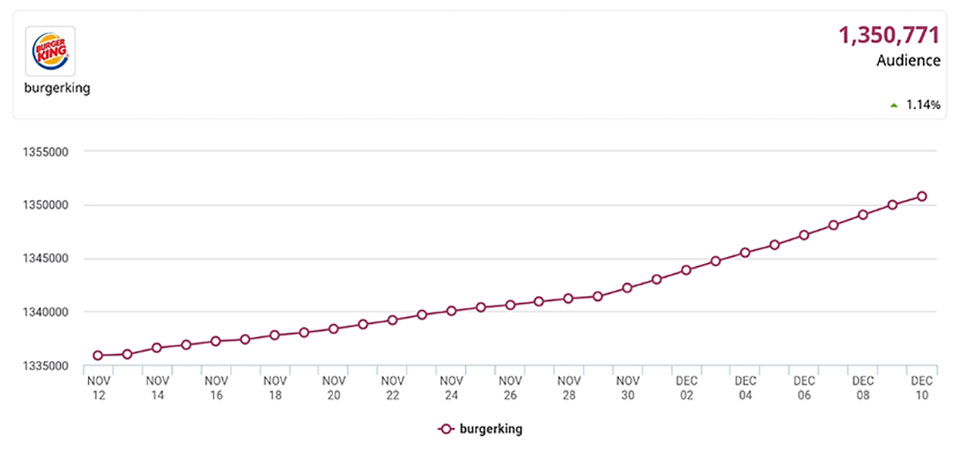
Graphs are the top data-presenting tool used by social media experts. Whether you need to show the audience engagement, growth, impressions or anything in between, we’ve created easily adjustable graphs that are perfect for screenshot capture and easy to export for your presentation needs.
Once you’ve connected your profile or selected the one of your competitors, you will be able to create a report with one click, giving you the full rundown of the social media analytics of your selected profile in a visually compelling manner. It’s just that simple!
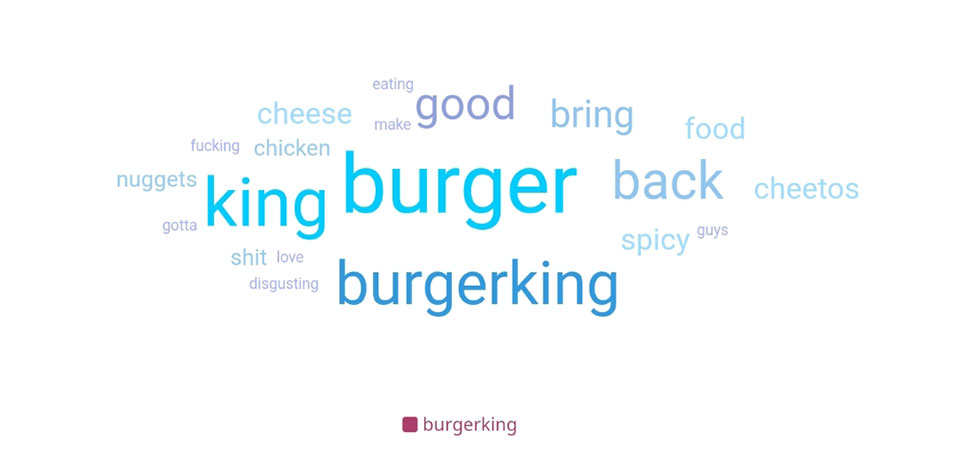
Word-Clouds, Top-Customers, Hashtags and More
A social media marketing strategy consists of multiple elements. For your convenience, and to provide you with deeper insights, Locowise gives you features that you won’t be able to find anywhere else.
From perfect demographics representations, to detailed, yet easy to read customer breakdowns, we’ve got it all!
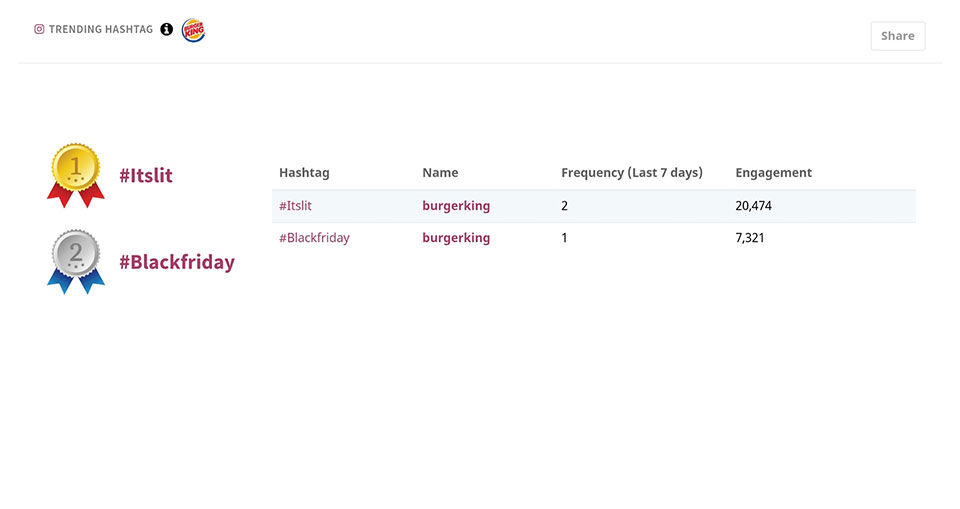
Want to impress your client? There’s nothing more compelling than having them see the success of your hashtag campaigns and the word-cloud of your customer’s responses in a simple glance.
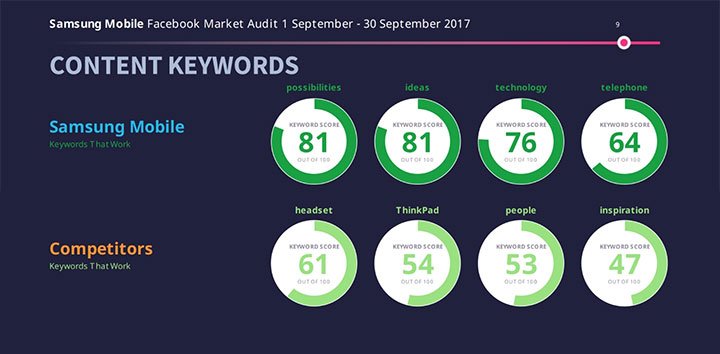
Detailed Industry Reports With Just a Few Clicks
Juggling dozens of clients is no easy task, especially for a digital marketing agency startup. That’s why, with Locowise you have the option to create complete social audits and industry marketing analysis reports with just a few clicks.
Simply select the profiles that you want to include in your report and you’d have a completely editable presentation ready-to-go in your email inbox in just a few minutes. Try it out now!
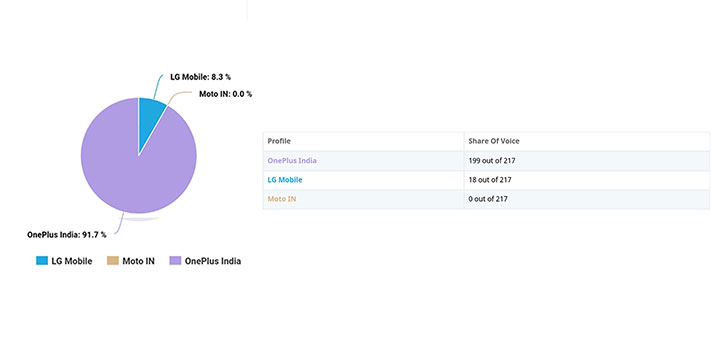
Multi-Profile Report Comparison
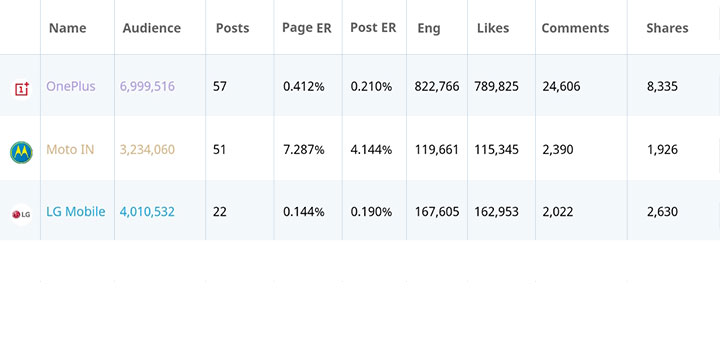
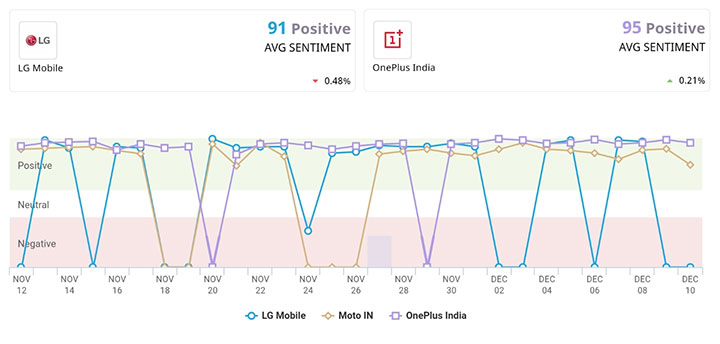
One of the top features you will have access to when you sign up with Locowise are the multi-profile reports.
The feature allows you to easily compare analytics from a certain social media platform on multiple platforms without breaking a sweat. Your clients will be impressed with the analytics, while you will be able to easily assess the performance of your selected brand with a selected competitor.
Stand-Alone Reports
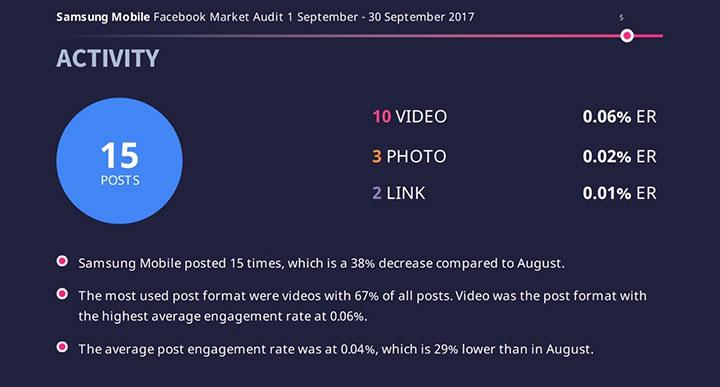
Need a stand-alone social media audit for a single case? We can help you out!
You don’t need to subscribe to Locowise to receive a neat visual analytics report in a few seconds. From a single profile audit to multiple profile reports we can help you finish your project in a prompt manner.
We have some amazing deals on single (and multiple) reports, thus don’t forget to check them out!
The Free Feature (Leaderboards)
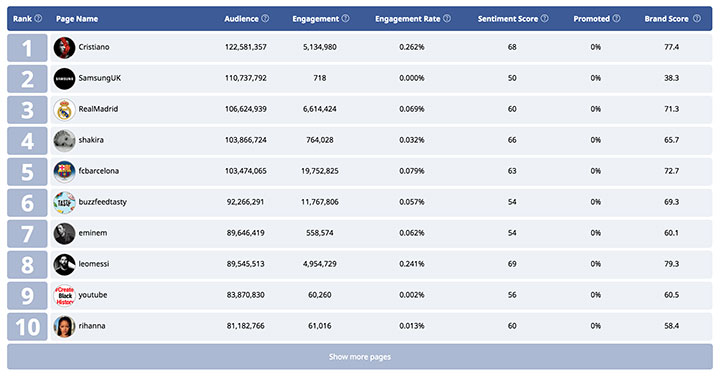
Want to check where your brand currently stands in the social media rankings? You can do so completely for free! Our social media brand leaderboards feature is free-to-use and all you need to do is submit your brand and check the leaderboards.
This free feature allows you to easily go through and see the top performing pages based on a multitude of analytics, simply by selecting any combination of an industry and country. Check it out now!
We’re Always Adding Something New!
And don’t think for a second that we won’t add new features in the future. We strive towards delivering the best visual social media analytics tool for digital marketing agencies. With that in mind, we listen to your feedback and we are constantly trying to improve both by tweaking existing features and adding new ones.
Plus, make sure to always stay tuned to our blog as we have experts giving advice on all things Digital Marketing that might inspire you to make your next big social media marketing move!
7-Day Free Trial!
Last, but not least, if you are interested in what Locowise has to offer, we have a special 7-day free trial version waiting for you. All you have to do is Sign Up! Once you do, you’ll be ready to access all the neat features of the platform we’ve just discussed. Make sure to learn more here!


