Only 7% Of Brands Posted Instagram Stories In October
Tina Ahmed posted on 23 November 2017
Welcome to our Instagram growth and engagement study for the month of October.
Instagram finally updated their API last month adding a lot of extra insights for Instagram Business Profiles. We’re going to expand our research this month with all this new and exciting data in the hope that you’ll find it useful.
Do sign up for a free Locowise trial right now in order to take advantage of all the new charts and insights for your Instagram business profile.
Let’s get started with a brief look at all the latest from the world of Instagram.

Instagram Stories now up on 300 million daily active users
It’s all about stories these days in the Instagram world. Instagram Stories now have 300 million daily active users. This is up from 250 million in June.
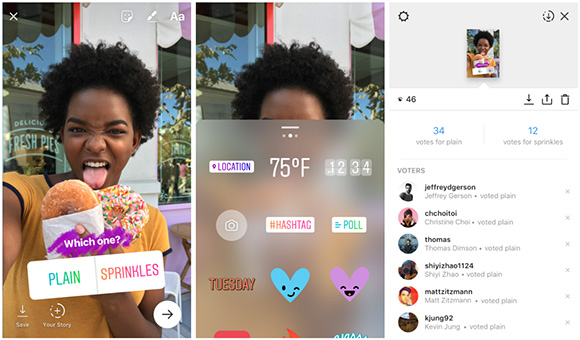
The app has added several updates during the month of October including the introduction of polls within stories and the superzoom feature too. You can now also add guests to your live streams too.
There hasn’t been much development in the growth and engagement during October for the 2,500 Instagram profiles that we look at every month.
Instagram profile growth was steady compared to September at 0.05% while post engagement rate was steady too at 0.7%. Photos engaged 0.8% of the audience while videos engaged 0.5%. Profiles we looked at posted 3.62 times per day during the month with 82% of all posts being images.
A look at the performance of the new Business Profiles in our database
In terms of Locowise and Instagram, the biggest update during October is that we have completely upgraded our Instagram data and charts.
If you’re running a business profile on Instagram (and you definitely should be doing that), you can now get access to a lot of new data points and insights.
We wanted to see what we could learn from this new access to a broader range of different Instagram metrics. This is why we decided to expand our study with a look all the new Business Profiles in our database.
So do keep in mind that this is a fresh database and it differs from our regular database that we use in our monthly studies. We’ll look to improve our main database for these monthly studies soon as we’re getting access to more and more business profile data.
Only 7% posted Instagram stories in October
100% of business profiles we looked at posted at least one picture during the month of October. The average profile posted 23 photos during the month. 72% of all the profiles posted at least one video with the average number of videos posted being at 6.
54% of profiles used the carousel format posting 4 carousels on average in October. Only 7% used Instagram Stories posting 7 stories on average during the month.
In terms of pure performance, the average carousel post reached 2.9% of the audience with the impression rate at 3.5%. Videos reached 1.9% of the audience with impression rate at 2.4%, photos reached 0.6% with impressions rate at 0.7% and Stories only reached 0.4% of the audience with the impression rate at 0.4%.
Carousel posts and videos seem to be getting a bit of a bump algorithmically compared to the photos format. Despite all of this 79% of all posts published in October were traditional standalone photos.

It’s also clear that not everyone gets to see your Stories either. Only a tiny part of your audience does and it’s not the best strategy to publish Stories only. Make sure you regularly update your main profile too in order to optimise your performance.
33% of people that see your video post watch for 3 or more seconds
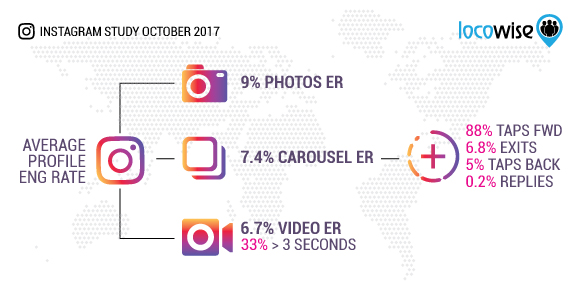
It’s a bit different but more familiar story when we look at the engagement itself. 9% of the people reached engaged with the average photo post, while 7.4% engaged with a carousel and 6.7% with a video. This makes it 0.13% of your total Instagram audience engaging with the average post.
There’s more positive news from the video side of things. 33% of people reached with a video post ended up watching the video for at least 3 seconds or more.
85% of people that viewed a story ended up engaging with a story too. 88% of all Story engagements were “taps forward”, 6.8% were “exits”, 5% were “taps back” and 0.2% were “replies”.
Instagram Story exits is one of those metrics that’s worth keeping an eye on in order to determine how relevant and engaging your stories are. To help you monitor this, we have introduced the “Completion Rate” metric for your stories. It basically tells you the percentage of your story viewers who completed viewing your full story. Check this metric today in your Locowise Instagram reports.
4.7% of all profile views results in website link clicks
Saving a post seems like one of those rarely used features. Of the nearly 6,000 posts we looked at, only 0.2% of the audience reached actually decided to save a particular post. Despite this, “saves” could still be a valuable indicator of purchase intent so do keep an eye on the posts that people tend to save more.
It’s a bit of a simplified calculation as Instagram allows you to follow profiles from more than one place and existing followers can view a profile too, but approximately 15% of all users who viewed a profile ended up following it.
4.7% of users who viewed a profile page ended up clicking on the website link and 0.7% clicked on the “contact” button. Interestingly enough, 63% of all clicks on the contact button were for the “directions”, 22% were for the e-mail address and 15% were on the telephone number.
Instagram is a mobile platform with especially stores and restaurant brands doing well which makes the fact that users look for directions more than for customer support is not too surprising. Lesson here for you is to make sure you fill in your profile and allow uses to find your location.

