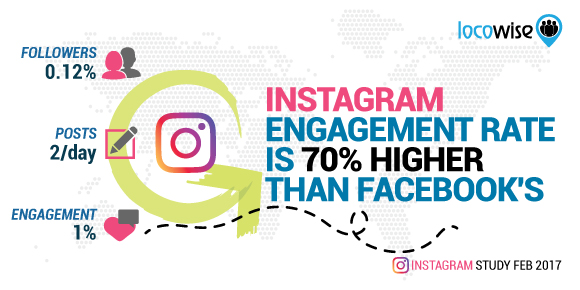
Instagram Engagement Rate Is 70% Higher Than Facebook’s
Tina Ahmed posted on 14 March 2017
Welcome to our Instagram growth and engagement study for the month of February 2017.
Just like every month, we analyse 2,500 Instagram profiles and look at their results. This helps you see the growth and engagement trends on the platform, and compare your performance against the standards.
Do you want to check your own growth and engagement stats and compare your brand to the 2,500 profiles in our study? Take a free trial of Locowise and use our Benchmarker tool to do just this.
Let’s take a look at the numbers from February.
Growth and engagement in February
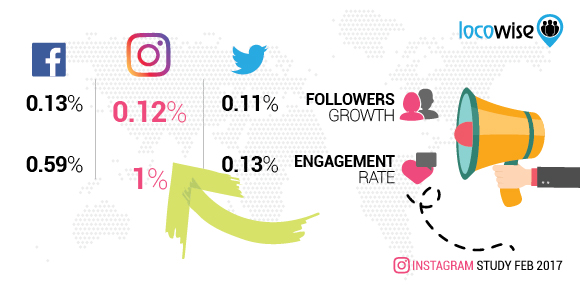
Instagram follower growth in February was at 0.12% of the total audience. This is a 33% increase in growth compared to the month of January. It’s the highest follower growth we’ve seen on Instagram since September 2015.
Instagram follower growth is 9% higher than the follower growth on Twitter (at 0.11%), but also 9% lower than the page likes growth on Facebook (at 0.13%). Page likes growth is one of the very few things that the parent company does better right now.
Instagram engagement rate was at 1.0% of the total audience in February. This is an 11% increase compared to January. It is also 669% higher than the engagement rate of 0.13% on Twitter, and 70% higher than the 0.59% engagement rate on Facebook. Instagram still is the king of engagement and the best social platform you can go to right now to achieve good organic engagement.
Profiles we looked at posted just over two posts on average per day with 86% of all posts being photos. Photo posts engaged 1.1% of the total audience, while videos engaged 0.8%. You get a 38% higher engagement by posting photos rather than videos, and this pretty much explains the continued popularity of photos on the platform despite all Instagram efforts to boost the use of video.
Share more than one photo or video in a single post
Instagram has in recent months succeeded in getting more people to post more often on the platform. Instagram Stories are one of the main reasons for this incredible growth. Users are starting to worry less and less about only posting the most perfect photos, but are also sharing more frequently the “less than perfect” moments of their days and lives.
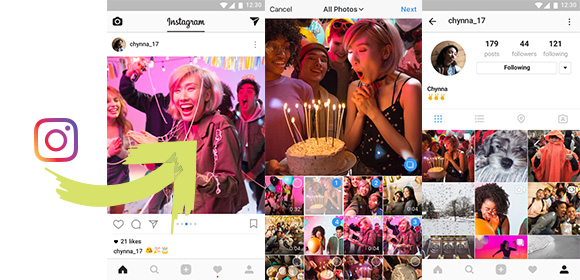
Now the company is trying to get some more of this “not so perfect” activity and engagement back in the news feed too. You can now share more than one photo or more than one video in a single Instagram post. This feature is now no longer only available to advertisers. And you can share up to 10 items in one single post. Plus you can mix photos and videos in one post too.
When uploading you will notice a new icon that lets you select multiple photos or videos. You can edit how the post looks like, you can reorder the media in the order that you wish to present them in, and also apply filters. In feeds, there will be blue dots on “carousel” posts to let people know that they can swipe for more.
There is also native support for Instagram carousel posts in Facebook newsfeeds. If you’re automatically sharing your Instagram posts to Facebook, they will display and look nice.
Experiment with the new carousel format
Our main advice for you for this month is to experiment with the new carousel format. Early days of new platforms and new features are always the best time to get some extra advantage before everyone else jumps on the bandwagon and things settle down.
Do you create how-to content and other step-by-step guides and tutorials? The carousel style could be a perfect way to showcase this content on Instagram in a very visual and easy-to-follow style.
Carousel is also a great fit for before and after pictures. Whatever it is you’re trying to show it is simple to find out with an easy swipe. How can you use “before and after” concept in your content calendar?
The carousel format can also be used as a simple photo or video gallery. Group all the best photos and videos from one event or about a specific topic in one post and share with your audience.
Swiping may still not be the most natural action in the Instagram app, so some users are including call-to-action to swipe on the first image in the carousel. It’s worth experimenting with and without this CTA in order to see what results your new posts get.
View all your posts in our “Content” section for a simple and quick overview of the performance. This makes it easy for you to identify and discover trends in your content. What works and what doesn’t. You can do this for your posts, but also for the posts of the profiles that you’re inspired by or simply the profiles of companies you’re competing against. This will help you a lot when sourcing and planning your content calendar for upcoming weeks and months.


