5 Lessons From 2013 That Will Turbo Charge Your Social Media in 2014
Team Locowise posted on 5 January 2014
2013 is behind us and we are now firmly looking at what we can achieve on our social media in 2014. Whilst the new year is here, we should not miss the opportunity to take a look at a few lessons learnt from 2013 that could turbo charge our performance in 2014.
We can learn massive amounts from taking a look at our channel data for the year. A full audit of 2013 will likely throw up some real nuggets of information for on-going best practice. However, time is precious, so my aim in reviewing is to quickly understand what worked so that I can consider how I may do more of it, and what didn’t, so I can obviously refrain from repeating. So, let’s look at some examples.

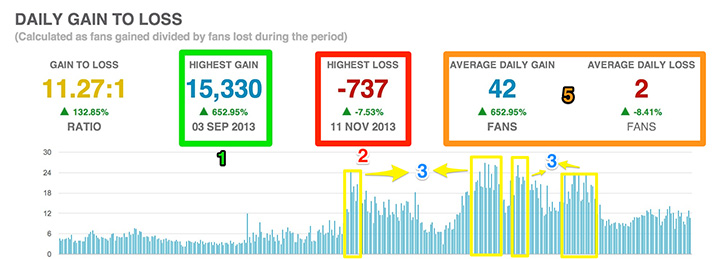
Looking at Facebook fan page likes and follower growth in isolation makes no sense. We have to look at both sides of the sum, that being the fan/follower additions and the unlikes/unfollows. When I review this page, a few things are worth looking at.
1. There were no ads for the page running at all for the year, so what is behind the incredible success of 3rd September. A click in the bar for that day will drive me to the posts which are worth looking at as well as check of referral traffic.
2. 11th November was massively above the average daily fan loss for the year. Again, a drill down on posts for the day, with a subsequent filter set to show the ones that generated the most negative actions will give us some guidance on what content was not well received. Additionally, take a look at post frequency, did we post more than normal on this day?
3. We enjoyed very strong performance in the second half of the year with some stand out periods. Review the content and post frequency for these days and establish if there is a theme to the posts. Maybe a new member of the team took over post content duties? 5. Some ready many benchmarks to consider how you are performing each day in 2014. Was today better or worst than 2013? Better, great! A week of worse and that should trigger a review of tactics.

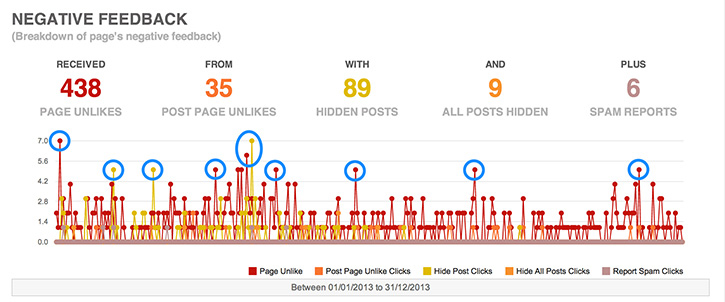
In 2013, Facebook gave greater emphasis to fan negative actions such as blocking a post or reporting as spam. Pages which receive high levels of these actions, can expect to be penalised by EdgeRank as Facebook continues to develop the algorithm to increase quality within the feed. Therefore, it makes perfect sense to take a look at the top 10 posts that received the most negatives in a year and understand why that may have been to ensure they are not repeated. Often it is the style of narrative, the purpose of the post (overtly commercial or too ambiguous) but whatever it is, you can make assumptions and see if there is a theme. Locowise users can click on the graph to be taken to the particular posts upon which they can do further analysis.

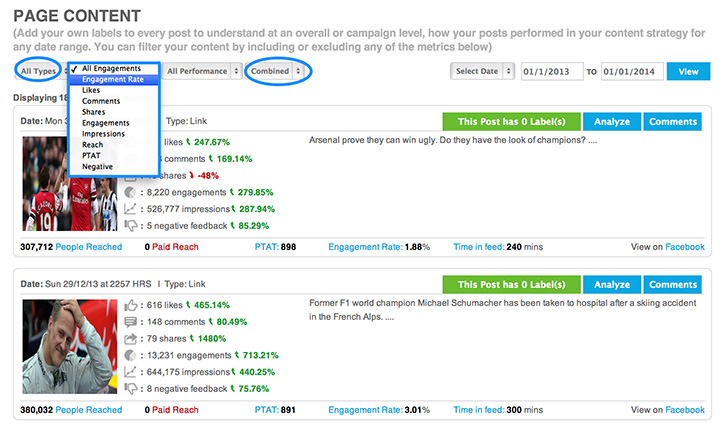
Line up a years worth of Post Engagement Rate data and you can quickly identify the outliers. Click through and instantly identify the posts that are responsible. Do they have anything in common? Are they repeatable? Is there any style or format lessons that can be learnt.

When your talking Facebook, it is difficult not to have a discussion without reach playing a big part. What we can see for this page is that reach is overall considerably up in 2013. We can again, quickly identify the outliers in the year and with a click through, take a look at the posts and see if there is a common theme or style. Does day of the week or time of the day play a part?
When it comes to reach type, we can easily see that whilst all have performed well in percentage terms. Photos and status have represented the best value in real terms whilst video owes it’s performance to the paid reach that occurred on the 14th October.

By this stage we should have a very good understanding of which posts have helped us grow our fan base, drive reach and produce engagement. However, there is still some useful questions to answer. How about understanding what the top posts were for each post type? How about separating your paid from your non-paid content and seeing which has performed best in each category? What content was shared the most in 2013? What I would be trying to build is a picture of what framework I can apply to my posting in 2014.
There are many, many more areas we could review such as post frequency, post timing and a deeper look at demographics. However, if we just work on the suggestions above, we will have a good understanding of drives our key metrics and what doesn’t.
Here’s to a turbo charged performance in 2014.


