The Essential Template For A Social Media Report
Sahail Ashraf posted on 7 March 2018
If there’s one aspect of working on social media accounts for brands that can cause a bit of a headache it’s the reporting stage. This is where you get to show your clients what you have achieved, what didn’t go so well, and what you intend to do next month (most social media reporting is on a monthly basis).
Whichever way you do this, in the end it comes down to the representation of numbers and facts. But brands don’t have the most time in the world to spend on listening to you, so presenting these details in a concise way makes perfect sense.
We’ve put together a rundown of how you should present the data. They’re not in order of importance, but this list should prove to be a solid social media template for reporting.

First of all, make sure you know what you’re talking about
Obviously, it is vitally important that you base your report on the stuff that matters. Making sure you’re reporting on the platforms that your client actually uses is a big thing. And if there are any KPIs the client has sent your way, they’re going to be included too.
But knowing what is actually important may be the biggest thing. If you’ve worked with your client and you understand who they are and what they need to do online, you should be able to put together a list of things they most definitely need to be aware of. Have that at your side as you work through the template below.
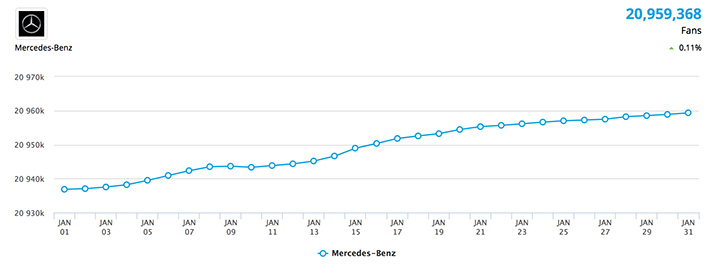
Audience size and growth
For each platform you should be able to outline the size of the audience that the client has. You also need to be able to show how that size has changed (or not) over the reporting period. While there are a million arguments about why engagement is more important than size, it is absolutely appropriate that your report starts with this kind of information, so that the client knows, overall, how healthy the accounts are.
Engagement
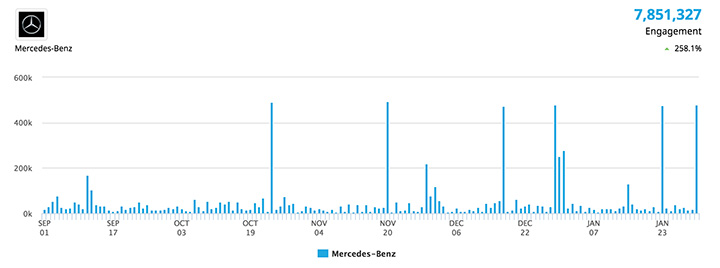
This is where you show what’s going on underneath the accounts. How the engine is working, and what it’s producing. The engagement on each account is what they are paying you to provide, incidentally, so hopefully you’ve got good news to share in this area.
Engagement is the total number of likes, retweets, comments, clicks, anything that happens on the accounts beyond you simply posting stuff. We’re talking likes, comments and shares, basically. If you have posted more than once in a day, then again it’s all about the total engagement. Two posts may have received a total of 100 engagements, but one of the posts gained 60. You can drill down later, but at this point in the report it’s about the total number.
Break it down into days of the month or week, or keep it as a monthly or weekly figure (depending on how often you report). And make sure you’re able to come up with a percentage figure for any rise or drop in engagement.
Engagement By Type
Here’s a crucial part of what you do. You’ve worked hard to put together posts that engage people. You’re giving the audience what they want. But you need to prove that you know what you’re doing here. So you put together another part of the report that shows the engagement rate ‘by type’ of post.

We’re pretty sure you don’t do too many text only posts these days but if you do, they need to have a figure next to them. Every type of post you do needs to have an engagement figure for the reporting period. Video, images, GIFs, whatever. This way you’re showing your client that you are experimenting (unless you’re not, because you just do one type of post because that type works) and that you’re monitoring and making decisions based on what works.
Sentiment
With as much out there that helps you gauge sentiment for a brand, you’d be silly not to report on audience sentiment. Even if you don’t have the best metrics platform around to scrape for data on sentiment, you should be able to put together an overall view of which posts garner which types of sentiment. If they gained nothing, or negative sentiment, you need to show you know this, so you can justify future content choices.

Engagement Rate
This is the secret sauce, the stuff that truly helps your client know what you’re doing and why it’s working so well. Engagement rate is a stat that simply shows you how many likes and follows and all the other kinds of engagement you receive, divided by the total number of follower or fans. Essentially, it shows how loyal and engaged your audience is. The higher the engagement rate, the better the account, and the more effective the account. The best way to do this is to have a full engagement rate report for the period you’re covering.
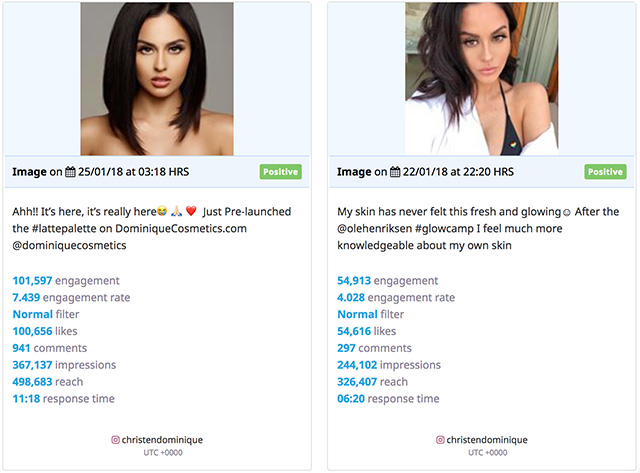
Then, you can take a ‘snapshot’ of a post to show the engagement rate it received as an individual post. Before you dive into the details of the best posts.
Here’s Christen Dominique. On the 22nd of January 2018 she had 1,363,216 followers on Instagram. The post in the shot above had a total engagement of 54,913 (likes, shares etc.). Divide the number of engagements by the follower number and you have that engagement rate.
It just shows how busy the account is, how popular it is and how hard you’re working to make the posts worth engaging with.
Top content
For each platform, rank the top performing posts according to their engagement rates you’ve got. This is a great opportunity to show how you’ve made progress and how good the work you’re doing is.
When they are ranked, the client gets a real feel for the success the account is having.

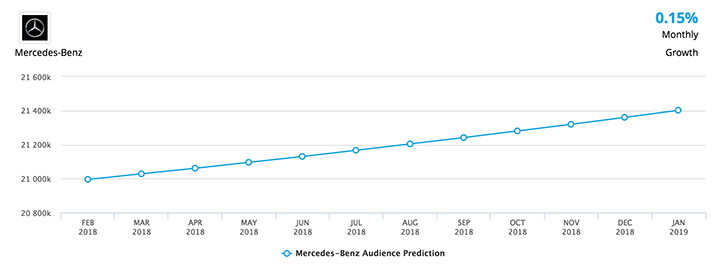
Estimated Growth
If you can nail down this metric it’s a good thing to get out there. Using your platform for metrics or even just a look back and an estimate from what you’ve already seen as regards growth, it’s great to be able to tell your client where you think the account is going in the future.
Stick to the above template and you should be able to give the client exactly what they need as regards your work and what it’s doing for them. It really is as simple as what you’ve just read. You’re focused on telling them what’s happening with their account, what works, and the results you’re getting. The above focus does all of that.
If you’d like to be able to do all of the above quicker, and with fancy charts that look amazing, try Locowise. We’ll give you a whole week for free.


